Quick links:
There are 108 different Kentucky Medicare Advantage (Medicare Part C) plans offered in Kentucky for 2026.1 Not every plan is available in each county, so it's important to find out which ones are offered where you live.
A licensed insurance agent can help you compare the availability, benefits and costs of Medicare Advantage plans in your area of Kentucky. Read below to learn more about Medicare in your state.
Average costs of Medicare Advantage in Kentucky
The average premium for a Medicare Advantage plan in Kentucky is $9.36 per month for 2026.1
Individual plan premiums, deductibles and out-of-pocket costs may vary greatly depending on where you live and the plan you have.
You can view the 2026 average Kentucky Medicare Advantage plan monthly premiums by county listed below in this guide.
A licensed insurance agent can help you compare Medicare Advantage plan costs in your area.
We represent carriers such as Humana, Aetna, UHC, Anthem BCBS*, Wellcare, HealthSpringSM, and Kaiser Permanente.
Enrollment may be limited to certain times of the year. See why you may be able to enroll.
Compare Kentucky Medicare Advantage plans today.
Speak with a licensed insurance agent
List of Medicare Advantage plans in Kentucky
The following table includes cost information and other plan details for Medicare advantage plans available in Kentucky in 2026. The plans listed are only representative of plans offered by TZ Insurance Solutions LLC. We do not offer every plan available in your area.
Compare Kentucky Medicare Advantage plans today.
Speak with a licensed insurance agent
Medicare Eligibility & Enrollment
If you want to enroll in Medicare Advantage in Kentucky, you must first be enrolled in Medicare Part A and Part B, often referred to as Original Medicare.
To be eligible for Original Medicare at age 65, you must meet the following requirements:
- You must be a U.S. citizen or permanent legal resident who has lived in the U.S. for five continuous years.
- You or your spouse must have worked long enough to be eligible for Social Security or Railroad Retirement benefits.
- You or your spouse must be government employees or retirees who have not paid into Social Security but have paid Medicare payroll taxes.
You may also be eligible for Medicare benefits under 65 if:
- You have been receiving Social Security disability benefits or certain Railroad Retirement Board disability benefits for at least 24 months.
- You have ALS (amyotrophic lateral sclerosis, or Lou Gehrig's disease).
- You have End-Stage Renal Disease (ESRD), and you or your spouse have paid Social Security taxes for a certain length of time.
If you have ESRD, you may be able to enroll in a Medicare Advantage plan or an Kentucky Medicare Special Needs Plan (SNP) that is specifically designed to help meet your health care needs.
Compare Kentucky Medicare Advantage plans today.
Speak with a licensed insurance agent
How to sign up for a Medicare Advantage Plan
Your first opportunity to enroll in a Kentucky Medicare Part C plan is during your Medicare Initial Enrollment Period (IEP).
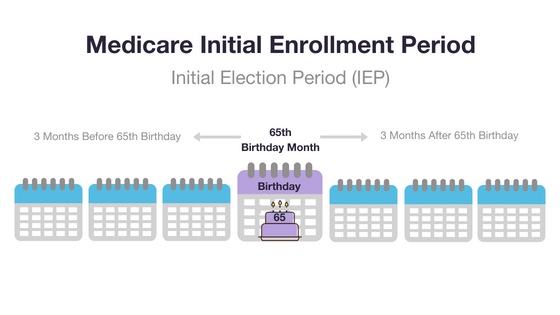
Your Medicare IEP starts three months before your 65th birthday. It includes the month of your 65th birthday and then continues for another three months after your birthday.
Additional times at which you may sign up for a Medicare Advantage plan include:
Fall Medicare Annual Enrollment Period (AEP) : October 15 - December 7
From October 15 to December 7 every year, you may enroll in a Medicare Advantage plan or switch from one Medicare Advantage plan to another.
Medicare Advantage Open Enrollment Period (OEP): January 1 - March 31
If you're already enrolled in a Part C plan, from January 1 to March 31 every year, you may switch Medicare Advantage plans or drop your Medicare Advantage plan and return to Original Medicare.
If you return to Original Medicare during this period, you'll be able to join a Medicare standalone prescription drug plan (Medicare Part D).
You may also drop your existing Medicare Advantage plan and return to Original Medicare.
During the fall open enrollment period, you may also join, switch or drop a Medicare Part D plan.
Medicare Special Enrollment Periods (SEP)
You may potentially be granted a Medicare Special Enrollment Period (SEP) at any time throughout the year for qualifying circumstances.
A licensed insurance agent can help you find out if you qualify for a Medicare Special Enrollment Period.
Compare Kentucky Medicare Advantage plans today.
Speak with a licensed insurance agent
Top-rated Medicare Advantage Plans in Kentucky 2026
Each year, the Centers for Medicare & Medicaid Services (CMS) issues star ratings for all Medicare Advantage plans using a system of one to five stars.
In order for a Medicare Advantage plan to be designated as a top-rated plan, it must have four or more stars out of five stars.
74.5% of 2024 MA plans in Kentucky that include prescription drug coverage were rated 4 stars or higher.1
Medicare Star Ratings
| Star Ratings |
|
★★★★★
|
Excellent
|
|
★★★★
|
Above Average
|
|
★★★
|
Average
|
|
★★
|
Below Average
|
|
★
|
Poor
|
Medicare Advantage plans are rated in the following five categories:
- Preventive care and health maintenance (screenings, tests, vaccines, etc.)
- Management of chronic conditions
- Member experiences and ratings of the plan
- Member complaints, problems receiving services and member retention
- Customer service
The information for the star ratings is gathered from information that is submitted to Medicare, Medicare’s regular monitoring activities and member surveys.
Compare Kentucky Medicare Advantage plans today.
Speak with a licensed insurance agent
Private insurance companies offer Medicare Advantage plans in Kentucky
Multiple insurance companies may offer Medicare Advantage plans in Kentucky, depending on where you live.
Some of the insurance companies who offer Medicare Advantage plans in Kentucky include:
- Humana
- Aetna
- UHC
- Wellcare
- HealthSpring
This is not a comprehensive list of all the insurance companies that offer Medicare Advantage plans where you live. You can visit Medicare.gov to see a full list of insurance companies who offer Medicare Advantage plans where you live.
Private insurance companies offer Medicare Advantage plans that may be unique to the plan area they serve.
Call to speak with a licensed insurance agent who can help you compare some of the Medicare Advantage plans that are sold in your area.
When you’re shopping for Medicare Advantage plans in Kentucky, you can compare plans from several different companies by using some of the following information:
- The Medicare Star Ratings can give you an idea of a plan’s overall quality.
- Agencies like A.M. Best, Moody’s and Standard & Poor’s can provide information about an insurance company’s credit rating and financial standing.
- Websites such as the Better Business Bureau and Consumer Reports can teach you about a company’s reputation among its customers.
- You can read through Medicare Advantage plan reviews and testimonials from customers.
Kentucky Medicare Advantage plans by county
Learn more about 2026 Kentucky Medicare Advantage plans by county.
Compare Kentucky Medicare Advantage plans today.
Speak with a licensed insurance agent
KY Medicare Advantage plans by type
The major types of Medicare Advantage plans include:
- HMO
A Health Maintenance Organization (HMO) usually requires patients to use health care providers and pharmacies that are part of the plan’s network (except in the case of emergencies) while also typically requiring a referral from a primary care doctor in order to see a specialist.
- PPO
Medicare Advantage beneficiaries in a Preferred Provider Organization (PPO) are able to see providers outside of their plan’s network, often at a higher cost.
Beneficiaries in this type of plan typically pay less out of pocket if they choose to receive medical services from providers within their plan’s network.
PPO plans typically do not require patients to acquire a referral before visiting with a specialist.
- PFFS
A Private Fee-For-Service (PFFS) plan determines how much it will pay to health care providers and how much the patient will pay when care is received.
With a PFFS plan, you can typically receive care from any doctor, hospital or health care provider that accepts your plan’s terms. Not all providers will accept these terms, however.
- SNP
A Special Needs Plan (SNP) is a type of Medicare Advantage plan limited to people with both Medicare and Medicaid, certain chronic conditions, or other specific circumstances.
Typically, you must receive care from health care providers and hospitals within your SNP network, except for in cases when you need emergency or urgent care and when someone who has End-Stage Renal Disease (ESRD) needs out-of-area kidney dialysis.
Not all of these types of plans may be available in your area. A licensed insurance agent can help you compare the types of 2026 Kentucky Medicare Advantage plans that are available where you live.
Compare Kentucky Medicare Advantage plans today.
Speak with a licensed insurance agent
Local health insurance resources in Kentucky
- State Health Insurance Program (SHIP)
State Health Insurance Assistance Programs (SHIPs) offer counseling and assistance to Medicare-eligible people in their local area. SHIP counselors can help Medicare beneficiaries, their loved ones and their caregivers navigate the Medicare program.
Find your local SHIP in Kentucky.
- Kentucky Prescription Drug Assistance Programs
The state of Kentucky has a number of programs designed to help with the cost of prescription drugs. There are programs for both Medicare beneficiaries and non-Medicare beneficiaries alike that can cover the cost of premiums and cost-sharing or even lower the cost of the drugs themselves.