
County Obesity Trends in America 2020
Ranking U.S. Counties Based on 10-Year Trends in Obesity Rates
Updated Dec. 7, 2021
According to data from the Centers for Disease Control and Prevention (CDC), more than 42% of American adults are obese.1 That rate has doubled in the past 20 years and has nearly tripled over the past 50 years.2
Obesity is one of the most prominent risks to the health of Americans, and that risk is amplified amid the outbreak of the novel coronavirus (COVID-19) pandemic.
People with obesity have an increased risk for severe (and potentially fatal) complications from COVID-19 infection. In fact, early data shows that obesity is one of the top underlying conditions among people aged 18-64 who have been hospitalized as a result of COVID-19, second only to hypertension.3
While the rate of obesity in America continues to grow every year, there are a handful of counties that are thinning their waistline and demonstrating a decreasing 10-year rate of obesity. The vast majority of U.S. counties, however, have shown increasing trends in the percentage of residents with obesity.
Using data from the CDC’s U.S. Diabetes Surveillance System, we analyzed obesity rates among adults age 20 and older in 3,142 counties and parishes in America between 2006 and 2016 (the most recent data available from this source).4
25 U.S. Counties With the Sharpest 10-Year Decline in Obesity
Issaquena County, Mississippi, located near the state borders of Arkansas and Louisiana, saw obesity rates decline 12.1 percentage points over a 10-year period, which is the largest 10-year decline of any county in the U.S.
The top five U.S. counties based on their decline in obesity rates are:
- Issaquena County, Mississippi: 12.1 percentage points decrease
- West Feliciana Parish, Louisiana: 11.6 percentage points decrease
- Dent County, Missouri: 11.5 percentage points decrease
- Greene County, Alabama: 10.2 percentage points decrease
- Iron County, Missouri: 9.8 percentage points decrease
Interestingly, Dent County and Iron County are adjoined counties in the Mark Twain National Forest, in Southeast Missouri.
We should note that even while Issaquena County saw its obesity rate drop from 39% of residents to 26.9% during the study period, over a quarter of Issaquena County residents have obesity.
The lowest percentage of county residents with obesity belonged to Teton County, Wyoming, at 12.3%.
| County | State | 2006 Percentage of Residents With Obesity | 2016 Percentage of Residents With Obesity | 10-Year Change (Percentage Points) | National Rank |
|---|---|---|---|---|---|
| Issaquena County | MS | 39 | 26.9 | -12.1 | 1 |
| West Feliciana Parish | LA | 32.7 | 21.1 | -11.6 | 2 |
| Dent County | MO | 32.5 | 21 | -11.5 | 3 |
| Greene County | AL | 45.6 | 35.4 | -10.2 | 4 |
| Iron County | MO | 33.8 | 24 | -9.8 | 5 |
| Lincoln County | GA | 33.2 | 23.5 | -9.7 | 6 |
| Mcduffie County | GA | 33.2 | 23.7 | -9.5 | 7 |
| Lake County | MI | 35.5 | 26.2 | -9.3 | 8 |
| Franklin County | MS | 41 | 31.7 | -9.3 | 9 |
| Jefferson County | GA | 37.2 | 28.6 | -8.6 | 10 |
| Gosper County | NE | 32.1 | 23.7 | -8.4 | 11 |
| Mercer County | MO | 30.9 | 22.6 | -8.3 | 12 |
| Dickinson County | MI | 31.6 | 23.4 | -8.2 | 13 |
| Cottle County | TX | 28.9 | 20.7 | -8.2 | 14 |
| Greene County | NC | 36.1 | 28.1 | -8 | 15 |
| Falls Church City | VA | 26.4 | 18.4 | -8 | 16 |
| Ozark County | MO | 31.1 | 23.2 | -7.9 | 17 |
| Clay County | IL | 29.9 | 22.1 | -7.8 | 18 |
| Miller County | GA | 31 | 23.4 | -7.6 | 19 |
| Stewart County | TN | 33.2 | 25.7 | -7.5 | 20 |
| Trousdale County | TN | 29.7 | 22.2 | -7.5 | 21 |
| Camden County | MO | 29.4 | 22 | -7.4 | 22 |
| Lexington City | VA | 27.7 | 20.3 | -7.4 | 23 |
| Bowman County | ND | 29.6 | 22.4 | -7.2 | 24 |
| Webster County | GA | 32.4 | 25.2 | -7.2 | 25 |
25 U.S. Counties With the Largest 10-Year Increase in Obesity
The area that saw the highest rate of increased obesity is Warren County, GA, whose increase of 26.6 percentage points was the highest in the nation. Warren County, located 100 miles east of Atlanta, saw its obesity rate climb from 31.3% of residents in 2006 to 57.9% in 2016.
Four out of the five U.S. counties with the highest increases in obesity rates are located in Georgia:
- Warren County, Georgia: 26.6 percentage points increase
- King and Queen County, Virginia: 24.5 percentage points increase
- Clinch County, Georgia: 22.9 percentage points increase
- Worth County, Georgia: 21.7 percentage points increase
- Toombs County, Georgia: 21.2 percentage points increase
With nearly 58% of Warren County residents who have obesity, the county also had the highest rate of obesity in the nation in 2016.
| County | State | 2006 Percentage of Residents With Obesity | 2016 Percentage of Residents With Obesity | 10-Year Change (Percentage Points) | National Rank |
|---|---|---|---|---|---|
| Warren County | GA | 31.3 | 57.9 | 26.6 | 1 |
| King And Queen County | VA | 28.6 | 53.1 | 24.5 | 2 |
| Clinch County | GA | 29.5 | 52.4 | 22.9 | 3 |
| Worth County | GA | 30 | 51.7 | 21.7 | 4 |
| Toombs County | GA | 27.4 | 48.6 | 21.2 | 5 |
| Pecos County | TX | 25.3 | 46.4 | 21.1 | 6 |
| Daviess County | MO | 26 | 46.3 | 20.3 | 7 |
| Franklin County | IA | 26.7 | 46.8 | 20.1 | 8 |
| Candler County | GA | 31.1 | 50.2 | 19.1 | 9 |
| Aleutians East Borough | AK | 30.8 | 49.9 | 19.1 | 10 |
| Colusa County | CA | 21.8 | 40.6 | 18.8 | 11 |
| Bowie County | TX | 29.3 | 47.7 | 18.4 | 12 |
| Frontier County | NE | 26.9 | 44.9 | 18 | 13 |
| Grant Parish | LA | 29.9 | 47.6 | 17.7 | 14 |
| Appomattox County | VA | 30.8 | 48.4 | 17.6 | 15 |
| Aleutians West Census Area | AK | 26.6 | 44.1 | 17.5 | 16 |
| Owsley County | KY | 30.4 | 47.6 | 17.2 | 17 |
| Lassen County | CA | 23.7 | 40.9 | 17.2 | 18 |
| Logan County | CO | 21.3 | 38.2 | 16.9 | 19 |
| Lee County | GA | 27 | 43.9 | 16.9 | 20 |
| Sevier County | TN | 28.1 | 45 | 16.9 | 21 |
| Crawford County | GA | 29.8 | 46.4 | 16.6 | 22 |
| Armstrong County | PA | 26.9 | 43.2 | 16.3 | 23 |
| Okfuskee County | OK | 32.5 | 48.8 | 16.3 | 24 |
| Coryell County | TX | 25.9 | 42.1 | 16.2 | 25 |
The Most Extreme Rates of Change in Obesity Rates Were in Southern U.S. Counties
10 of the 11 U.S. counties that had the largest decrease in obesity rates are located south of the Mason Dixon line, in Mississippi, Louisiana, Alabama, Missouri and Georgia. Lake County, Michigan, was the lone northern state to crack the top 10.
- Missouri claimed three of the top 13 counties with decreased rates of obesity (Dent, Iron and Mercer Counties) and five of the top 23 counties.
- The state of Georgia lays claim to three of the top 11 counties for improved (decreased) rates of obesity (Lincoln, McDuffie and Jefferson Counties).
- As noted above, however, the Peach State is also home to four of the five counties that experienced the highest rate of obesity growth. Georgia is home to seven of the 22 counties in the U.S. with the most drastic 10-year increase in obesity rates.
Of the 25 counties with the highest increase in obesity rates, 16 are located in the south or southeast region of the country.
Only 15% of all counties in the U.S. experienced a 10-year decrease in obesity rates.
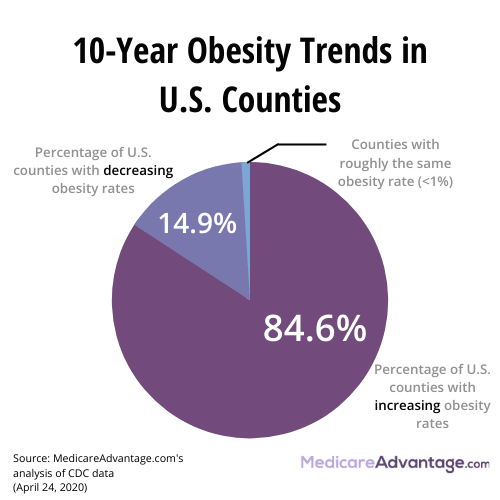
The overall 10-year obesity trends of all U.S. counties are mostly trending toward increased obesity:
- 2,651 counties experienced a 10-year increase in obesity rates (84.6% of counties)
- 466 counties experienced a decrease in obesity rates (14.9%)
- 17 counties saw their obesity rate remain roughly flat (<1%)
- 13 counties were not included in the study because sufficient data was not available. 10 of those counties are in Alaska.
Other notable findings include:
- Only 4 counties experienced an obesity rate decrease of 10 percentage points or greater
- 8 counties had obesity rates that increased 20 percentage points or greater
- The obesity rates of 338 counties increased by 10 percentage points or greater
Methodology
The study was conducted by analyzing data from the Centers for Disease Control and Prevention Division of Diabetes Translation, using the U.S. Diabetes Surveillance System Diabetes Atlas to extract county-level data for age-adjusted obesity rates in 2006 and 2016 for adults aged 20 years and older.
The 2016 data is the most recently available from this data set. For more information on how the CDC county-level estimates are obtained, visit this FAQ page at cdc.gov.
Notes
While we tried to remain as scientific as possible in our methodology, any study of health remains highly subjective. These results show an association but do not prove causality.
Fair Use Statement
Of course we would love for you to share our work with others. We just ask that if you do, please grant us the proper citation with a link to this study so that we may be given credit for our efforts.
Research and reports
Our research reports analyze a number of issues important to seniors, from health perceptions, medical communication, health habits, and more.